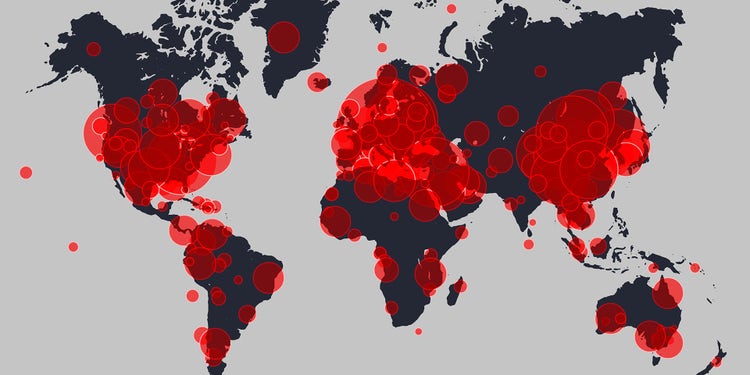
The number of confirmed cases of COVID-19 has crossed the 2.5 million mark and continues to grow, making life more difficult for people across the world. Industries are still reeling under the impact and are faced with increased pressure as the ensuing lockdown brings non-essential businesses to a near-standstill. Both public and industry are turning to credible sources for information on the outbreak, and applications built on geographic information systems (GIS) have proven especially critical to communicating the impact and planning the response.
For decades, GIS-based tools have been used to respond to crises. Although rooted in geographical location data and mapping, GIS tools and applications layer all types of data to create tailored 2D and 3D visualizations. During this current crisis, organizations and agencies the world over have integrated data on the number of confirmed coronavirus cases, deaths, and recoveries with geospatial data to assist agencies in communicating critical information to the public and essential service providers. These tools are proving to be extremely effective in determining the impact of the virus on regions, tracking changes over time, identifying patterns, and understanding underlying relational data that can help organizations react, respond, plan, prioritize, and make decisions.
While map-based applications are common and extremely useful, the underlying data can be customized and used to explore deeper connections and comparisons for tactical responses and strategic planning. One widely used and trusted source of COVID-19 information is the World Health Organization (WHO), and their GIS-based mapping application is available online for the public or organization to leverage. WHO even allows users to download the underlying map data to integrate with other GIS applications.
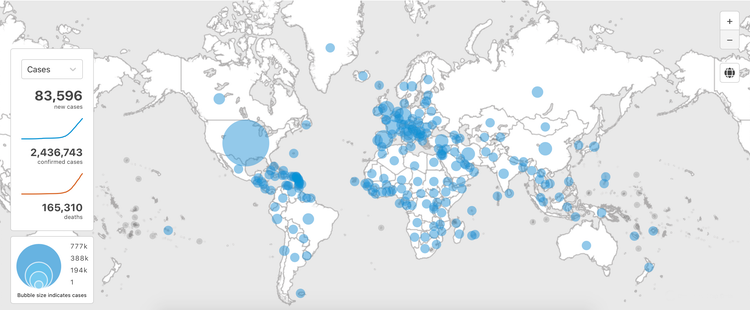
Figure 1: Global coronavirus cases as of 2020/4/22, 1:00 pm CEST
Source: World Health Organization
In addition to maps, the WHO is utilizing GIS tools that enable the public to follow confirmed COVID-19 cases and related deaths in a country over time. This helps in visualizing how the regional statistics have changed through a given period relative to a country’s population.
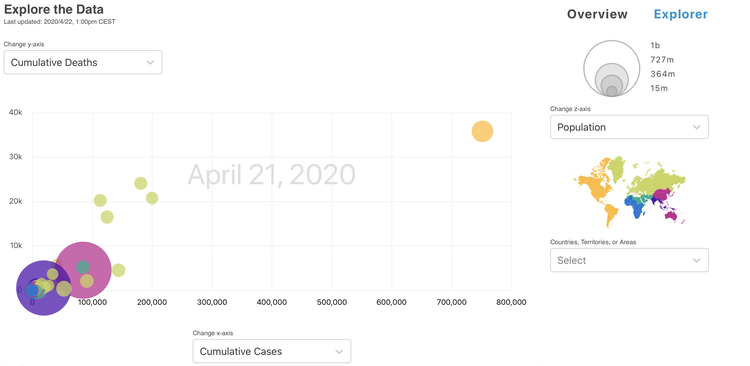
Source: World Health Organization
[This is a screen capture of a video that shows growth over a period.]
Custom Tools for Public Agencies and Governments
While the outbreak data and statistics are essential inputs, GIS mapping tools can integrate other data sets or real-time inputs to build customized applications to share:
- Location of medical facilities and testing centers relative to virus hotspots
- Availability of open hospital beds or other critical medical capacities in hotspot areas
- Mapping essential businesses open in a local area
- Areas with critical supplies and equipment shortages
- Community needs for food, supplies, or childcare to enable assistance from social services organizations
- Areas hit hard by unemployment to allocate additional resources and support
- Risk assessments using analytics to correlate demographic or relevant health information for the public
- Communications from local government or medical agencies on increased risk areas and hotspots
Industry Applications for Localized Needs
Access to applications and tools that help a business make data-driven decisions has become a top priority as a result of the current crisis. Companies that invested in digital projects are better positioned to react, respond, and implement business continuity plans during this pandemic. As a result, more organizations are using this time to re-evaluate their innovation investment strategies and prioritize digital and data-driven projects to manage risk in operations for the future better.
Many GIS and data-driven applications have been developed as a result of crises. Whether responding to a pandemic, a natural disaster, or an unpredictable event or accident, more businesses, industries, and governments are using data to prepare for high-impact scenarios and make better operational and infrastructure decisions to mitigate risk.
How have GIS applications and data helped businesses respond?
During the COVID-19 Pandemic
- Facilities use GIS applications to plan and communicate reallocation of space for emergency use or to temporarily house essential staff.
- Companies map out and deploy critical assets to remote workers and work from home employees for business continuity.
- Communications service providers mobilize resources, bandwidth, and infrastructure support to physical areas of peak network usage or first responder activity to keep communications lines open.
- Businesses visualize where critical inventories need to be repositioned or where backup supply sources need to be established to minimize risk in the supply chain.
During Natural Disasters or Accident Response
Flood modeling solutions use GIS, city infrastructure data, weather forecasting, and historical data in flood and water inundation algorithms to identify risks to infrastructure and populated areas. This enables cities to plan and respond better, keep citizens safer, and reduce economic impact from heavy rains or hurricanes.
Figure 2: Cyient Flood Modeling Application using GIS data
- Cities can monitor and track building code compliance and infrastructure regulations to highlight areas at risk of damage in earthquake zones or to plan infrastructure improvement projects that reduce risk in the future.
- GIS applications can integrate IoT data from air quality sensors to pinpoint environment risk locations and potential public health exposure in response to wildfires, explosions, or chemical leaks. These applications can also model strategic or long-term environmental impact from population changes, business expansions, or policy changes.
- Mapping risk scenarios for businesses with dangerous equipment, explosive materials, or radiation risks can help prevent or respond to accidents that could impact employee or public safety.
While data-driven applications are becoming more and more critical, the integration of data with GIS tools enables the next level of understanding for a big picture view or to zero-in on the local impact. Expanding out and drilling in to assess the effects of events large and small can not only save time and resources but, as we are witnessing during the coronavirus crisis, can provide insight and direction that impact health and safety and even save lives.
As Winston Churchill famously said, “Out of intense complexities, intense simplicities emerge.” The world is hopeful that we emerge from the COVID-19 global pandemic better prepared for the future. Technology such as GIS and data-driven tools can help us simplify these complexities for better preparation and response under crisis.